A large part of the modern Mustang hobby revolves around data. Whether we’re researching our next modification, looking for installation tips, or tuning the engine computer, having data is crucial. Many racers have relied on data acquisition systems for years. Gathering data about a run on the dyno, a lap around the track, or a trip through the quarter-mile can make the difference in a car’s success on race day.
There are several hurdles that keep many sportsman level racers and weekend enthusiasts from utilizing a data acquisition system. The first hurdle is cost, depending on how complex the system is, and how many inputs (also known as channels) the system can monitor, as well as other features.
Data acquisition systems can be extremely expensive. Complexity is another area to consider. These systems often involve not only dozens of wires and numerous sensors to install, but also may require an engineering degree to decipher the information properly.
AEM Electronics has been manufacturing electronics for automotive enthusiasts for nearly three decades. Applications have ranged from enthusiasts looking to improve fuel economy and gas mileage, to hardcore racers. A few years back AEM released the AQ-1 data logger, part number 30-2500. The system takes much of the cost and complexity out of owning a data acquisition system.
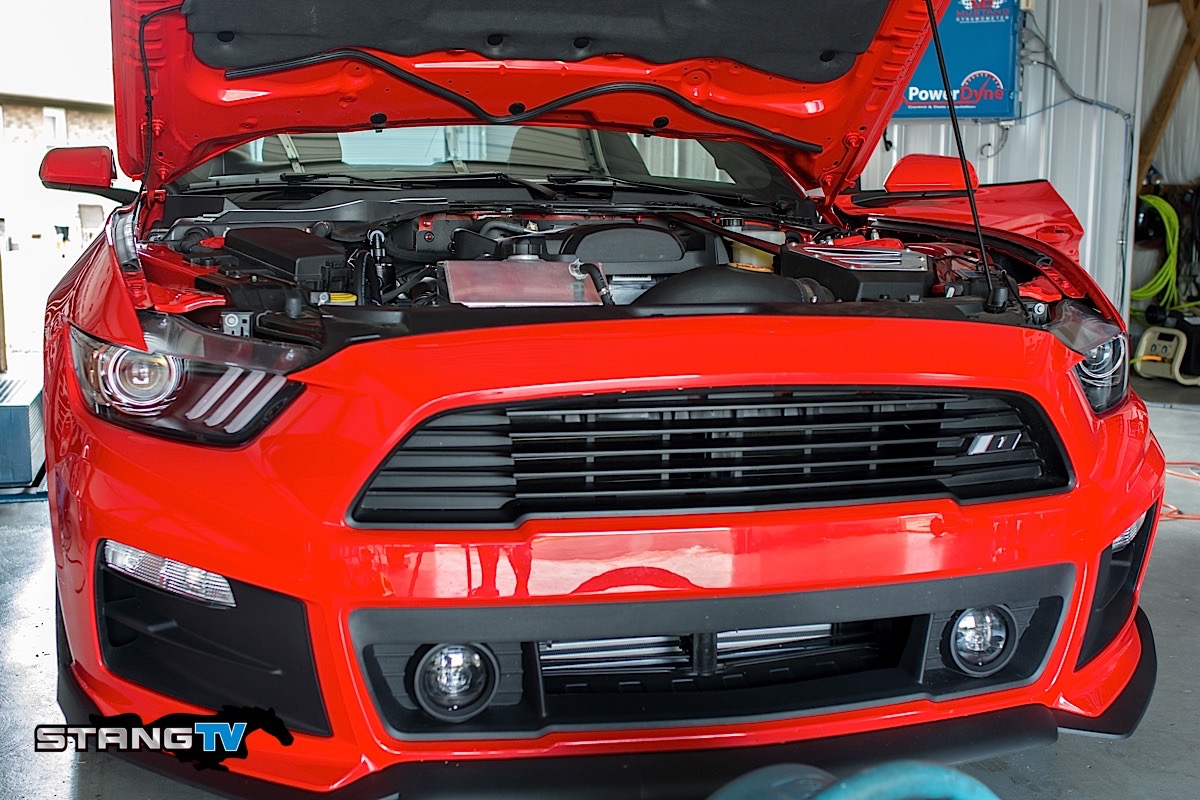
For our 2015 Mustang Roush RS1 EcoBoost – Project 5-Liter-Eater, we knew we wanted the capability to record data beyond what we can see via our OBD-II port. That data includes intake air temperatures before and after the intercooler, as well as boost pressure, engine RPM, g-force, wideband oxygen sensor, and even GPS data. We also wanted the option to add more data logging channels later.
My First Logger
The AEM Net CAN Cable can be used to capture additional channels, with the Infiinity ECU it can capture as many as 128 channels.- Lawson Molica, AEM
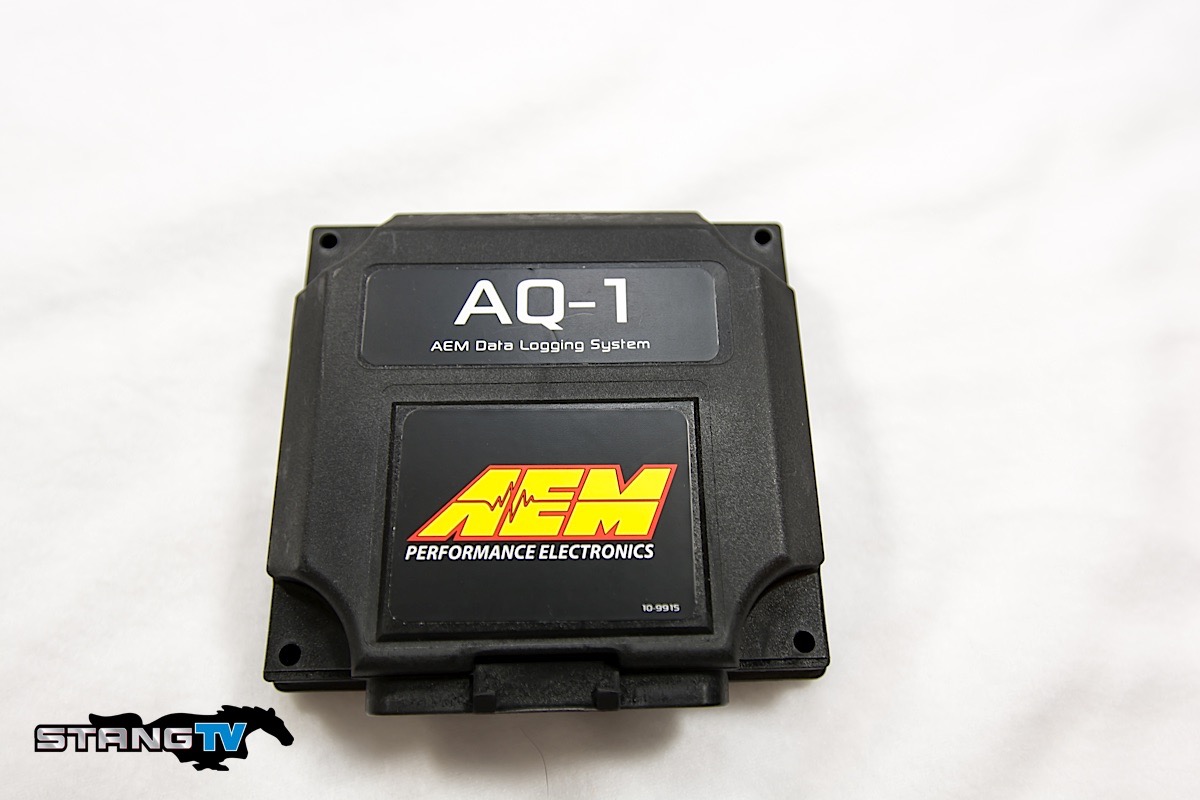
The AQ-1 module itself is smaller than 5 by 5-inches, and can be mounted inside a vehicle, or under the hood on race car applications that won’t see it subjected to substantial moisture and dirt exposure. The AEM wiring harness features 12 inputs, and can interface with any AEMNet enabled components, further expanding the AQ-1’s logging capabilities to 128 channels according to Molica.
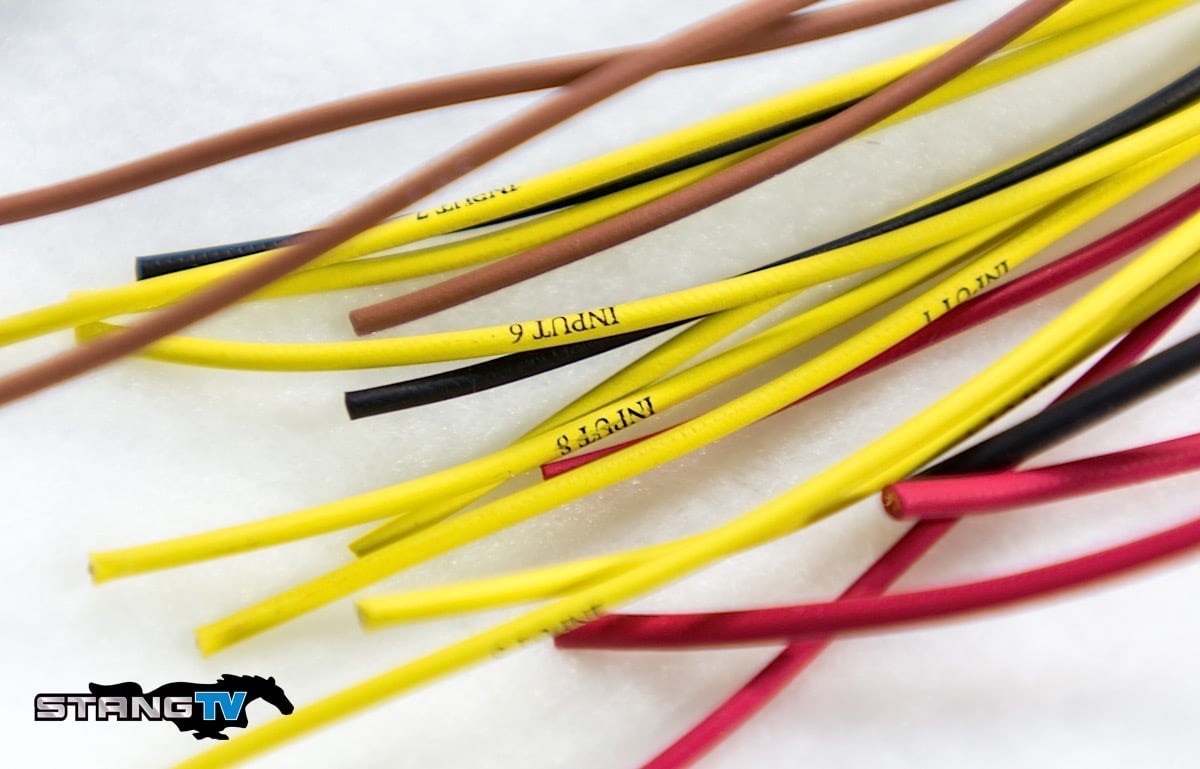
We are using AEM's 96-inch harness on our car, giving us enough wire to feed from under our passenger seat to the engine compartment. The wires in the harness are screen printed for easy identification.
The AQ-1 is easily installed. Most enthusiasts with some basic knowledge of wiring, and what they want to log, can install this system in a day. AEM offers multiple harness lengths, and the AQ-1 system operates on low voltage and current.
The AQ-1 includes a 2 gigabyte (GB) secure digital (SD) storage card for storing data logs. While this doesn’t sound like much, depending on the number of channels being monitored, just 2 GB can record hours of data. The AQ-1 is compatible with up to a 32 GB SD card.
The logger is so user-friendly, and has become so popular that NMRA has approved its use in a variety of classes where data-logging was never allowed in the past.
Sensor Options
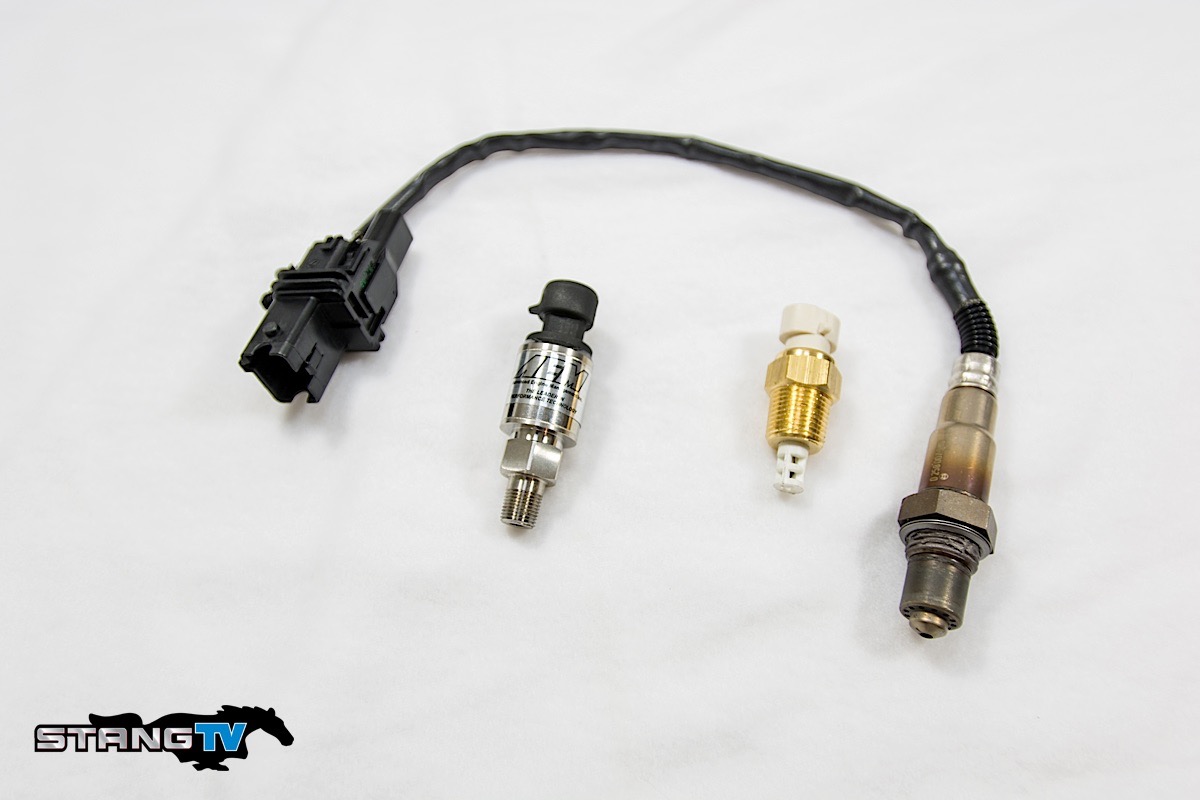
AEM Parts List
30-2906-96 -96-inch harness 30-2010 -Air Intake Temperature Sensor (2 used) 30-2130-50 – 3.5 Bar (50PSIa) MAP Sensor 30-2310 -Wideband UEGO controller with sensor.
Adding to the flexibility of the system is the ability to tap into OEM and aftermarket sensors. This includes inputs such as brake pedal, vehicle speed, engine RPM, coolant temperature, fan, oil pressure, and more.
Molica says that having the capability to monitor this wide array of sensors allows owners to not only select which sensors they want to monitor, but also be able to tap into existing sensors that may already be on their vehicle. “You can add vehicle speed, accelerator pedal position, throttle position, or many other inputs using the factory hardware.” AEM’s Paul St Clair also told us, “You can typically tap into the OEM inputs without causing unnecessary noise or interference to the OEM electronics that could trigger a malfunction indicator lamp, or check engine light.”
The AQ-1 offers four channels for two wire sensors, with four more channels for powered three wire sensors. There is a serial connector which can be used for GPS or other serial type devices. The system also includes three digital signals. These can be used for on/off-type switches such as nitrous, brake pedal, or other digital signals. There’s also a connector for AEMNet-enabled devices.
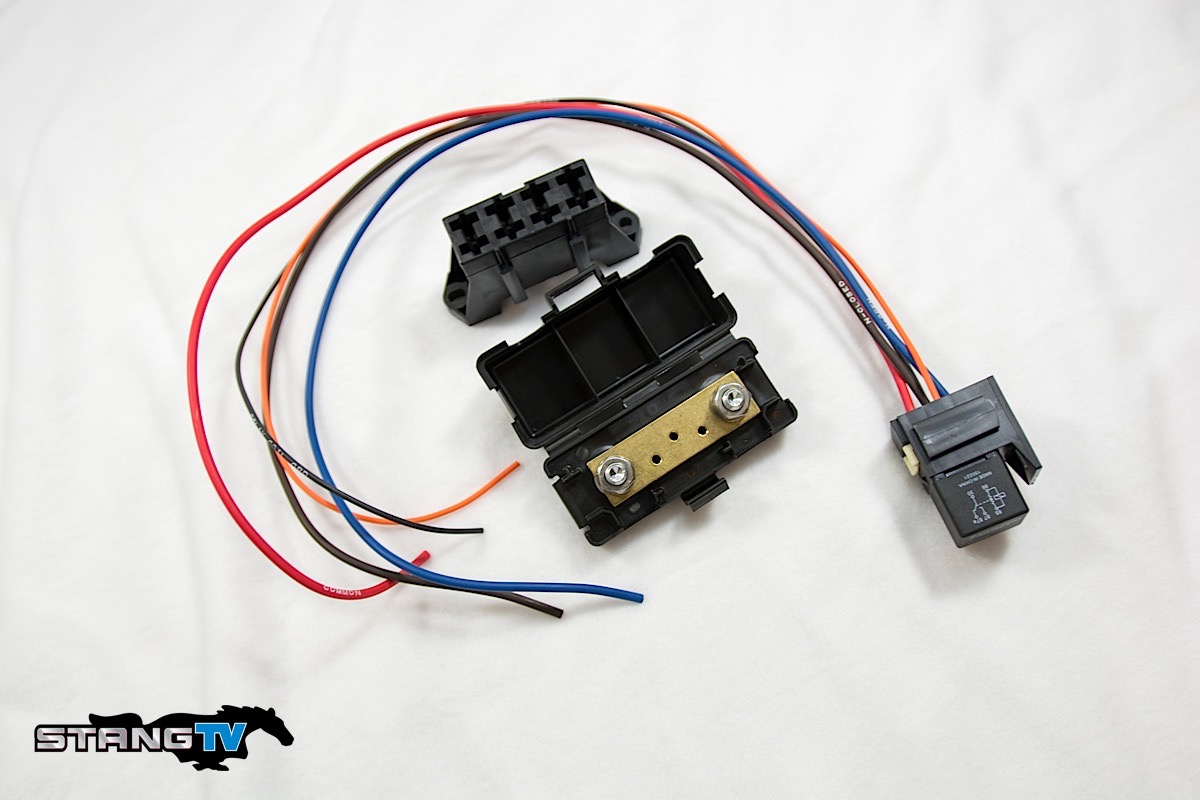
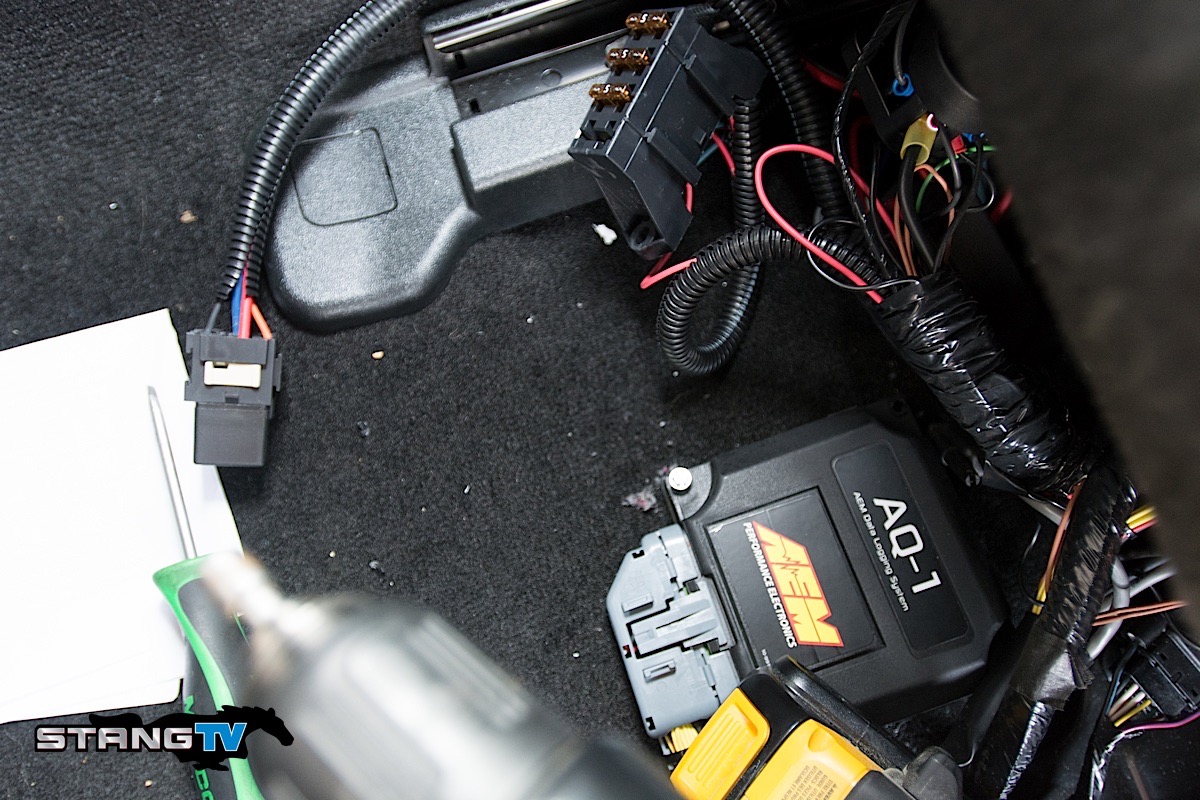
Left: Ron Francis Wiring supplied us with everything needed to power our AQ-1, including a junction block, fuse block, and 40 amp relay kit. Right: We mounted our AQ-1 under the passenger front seat to keep it away from dirt and moisture, but allow access to the wiring if troubleshooting becomes necessary.
Infinity And CAN
A few years back AEM introduced AEM Net, its internal CAN/BUS system. This networking solution allows multiple AEM devices to network together, sharing data, and simplifying the wiring of a system. The AQ-1 is no exception to this, and using AEM Net with the AQ-1 makes the data logger even more powerful, increasing the number of inputs by nearly 10 times.
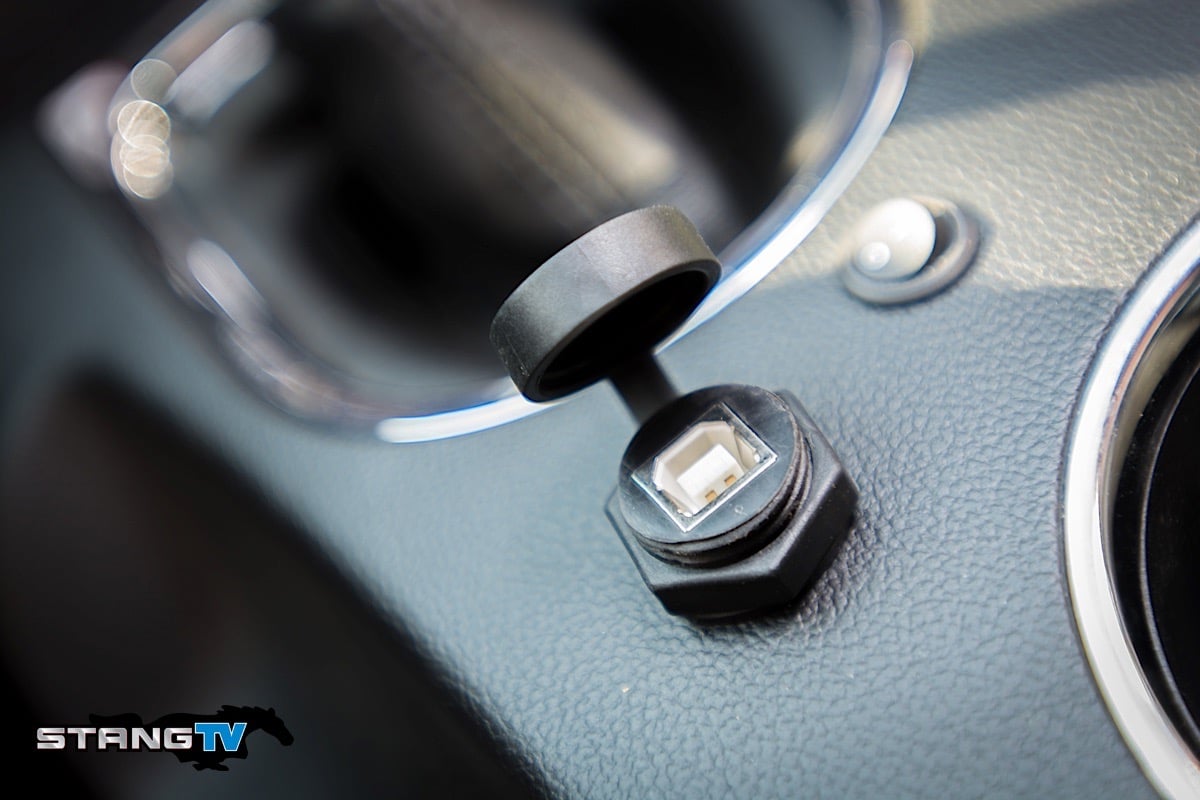
We installed the AQ-1 data port in our center console, along with a rocker switch connected to digital input 1. The rocker switch triggers the logger to start and stop logging, and this location for the data port allows us to easily connect a laptop for configuration, monitoring, or downloading logs.
The AQ-1 can capture nearly every input or sensor from AEM’s infinity ECU, all that’s involved for wiring this is to connect the AQ-1 and Infinity ECU via the AEM Net CAN/BUS cable. This allows the AQ-1 to record in tandem with the Infinity, giving AQ-1 users the maximum amount of data possible. “The AEM Net CAN Cable can be used to capture additional channels, with the Infinity ECU it can capture as many as 128 channels,” Molica says. That’s a lot of data, and if knowledge is power, AEM customers will have one of the most powerful ECM/Data Acquisition combinations currently available on the market when combining these two, according to Molica.
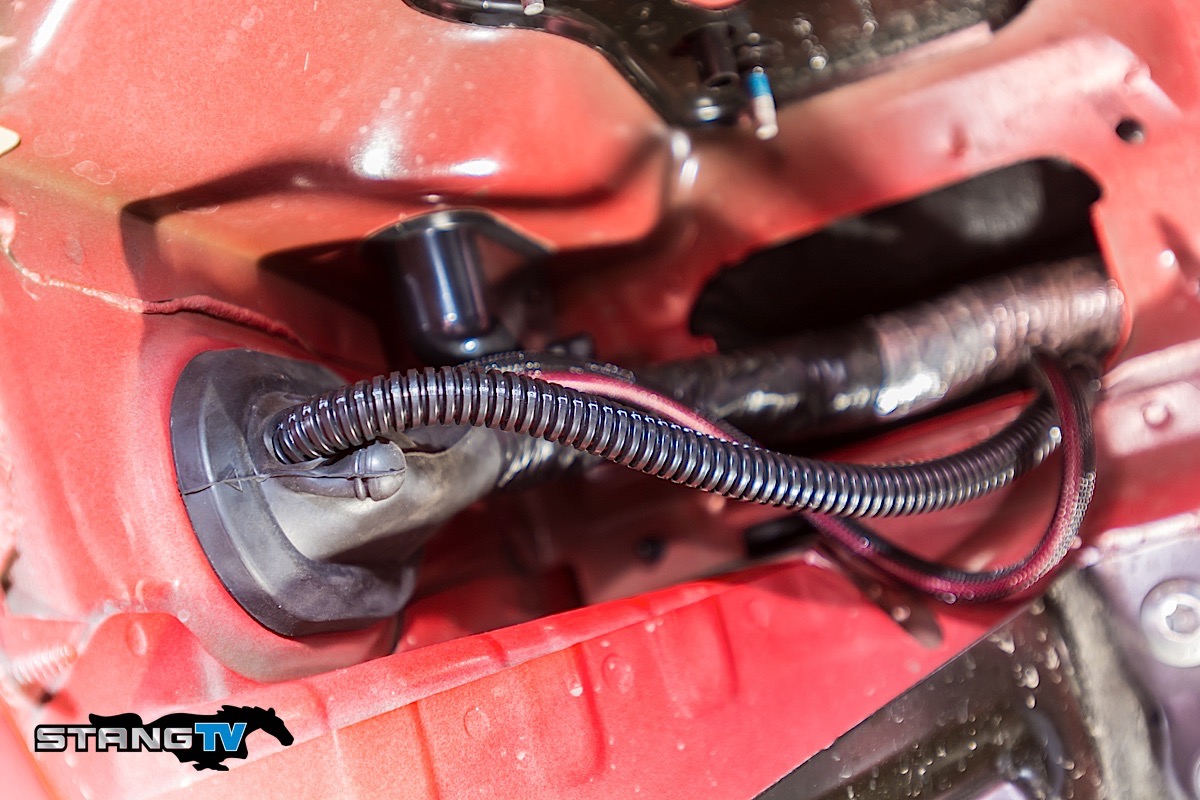
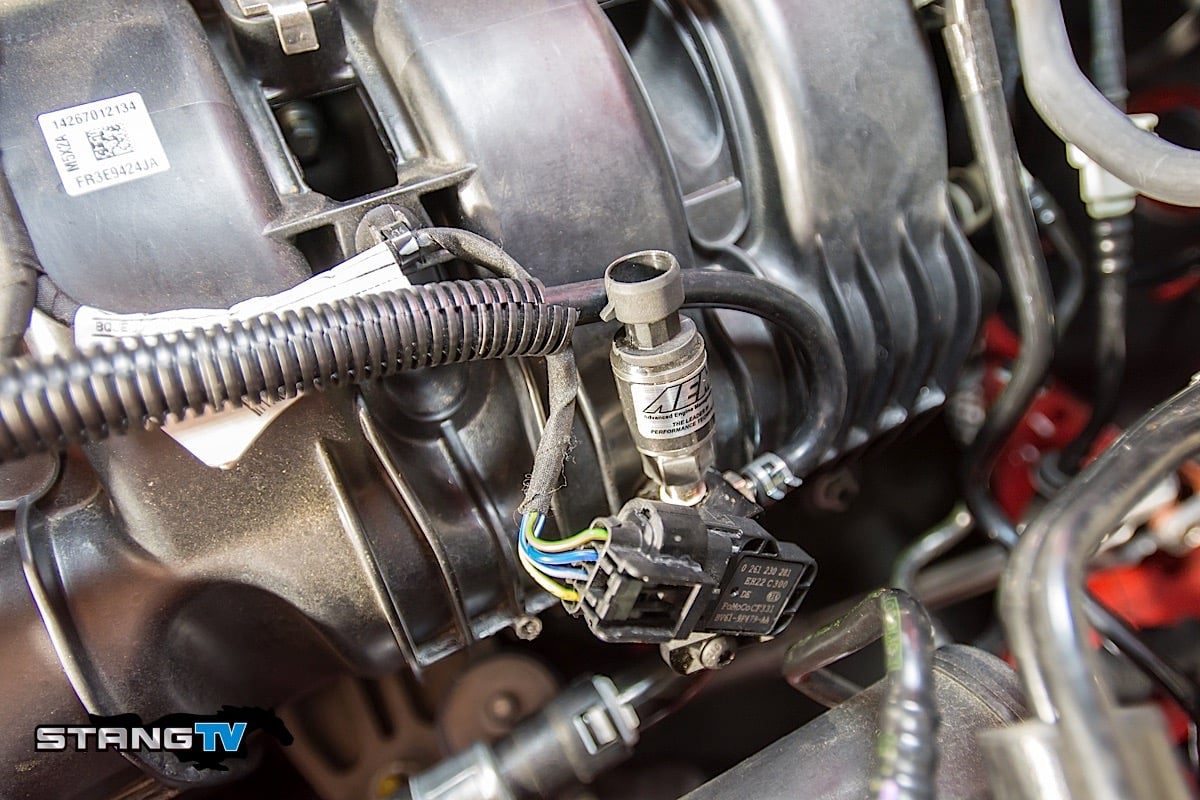
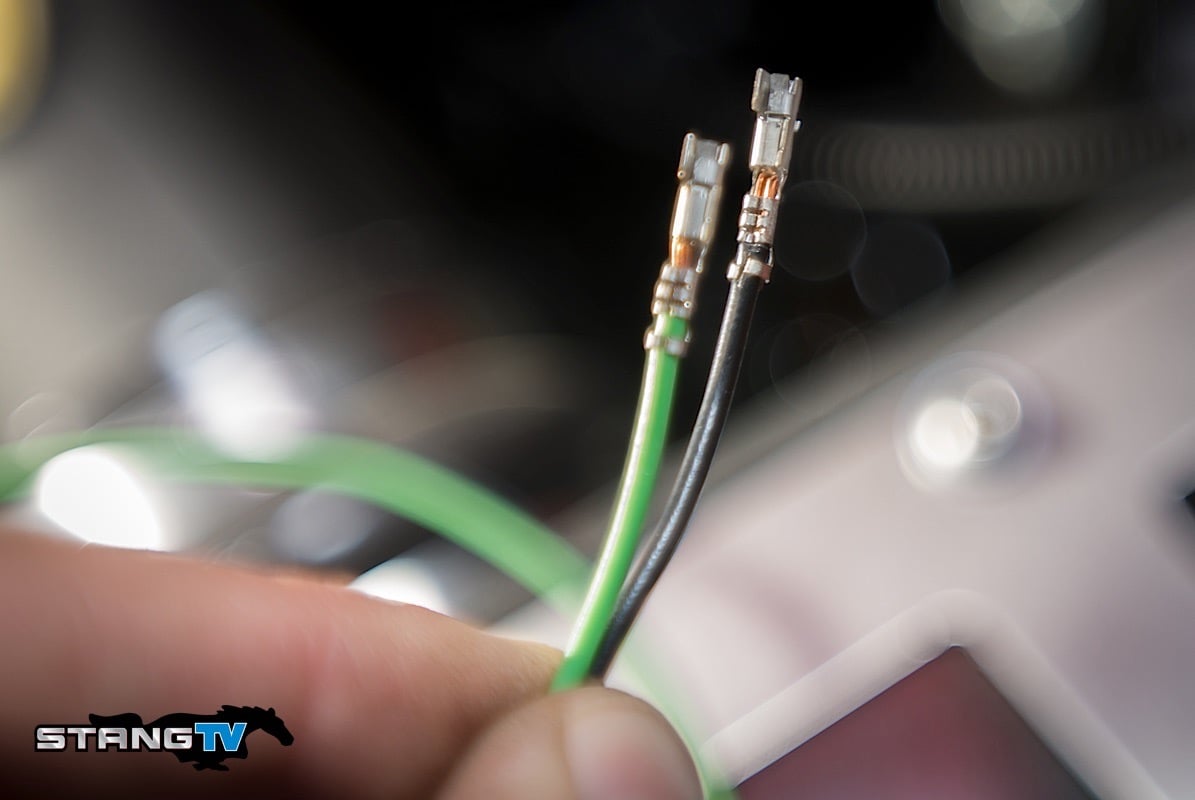
Top Row: Left: We used an existing OEM wiring harness grommet to route our wires through the firewall. This grommet is located in the passenger front wheel well, and comes into the cabin near the kick panel fuse block. The inner fender shield provides additional protection for the wires, and we were able to route the harness over the subframe and into the engine compartment. Due to high heat from the turbo and exhaust, we used heat protection sleeving provided by Ron Francis Wiring. Right: Remember the extra port on the billet aluminum block that was included with our Turbosmart blow off valve kit? We're using that port to directly connect the AQ-1 MAP sensor, giving us a reading at the intake manifold. Bottom Row: Left: All AQ-1 sensors require crimping on terminal ends. If you don't have a set of terminal pliers, you can pick them up from Jegs.com or Ron Francis Wiring. The wires must be pushed through the connector prior to crimping on the terminal ends. Right: Once the terminal ends are crimped on, the wires are pulled back through the connector and will snap to lock them in position.
AEM Data
Deciphering the data and making sense of it is critical to getting the most from a data acquisition system. AEM offers its AEM Data software as a free download form the company web-site. This software allows AQ-1 users to load log files from the AQ-1, and then look at the information in almost any way they see fit. This includes various methods for viewing the data in a graph, comparing multiple logs, and even video overlay (more on that in a minute).
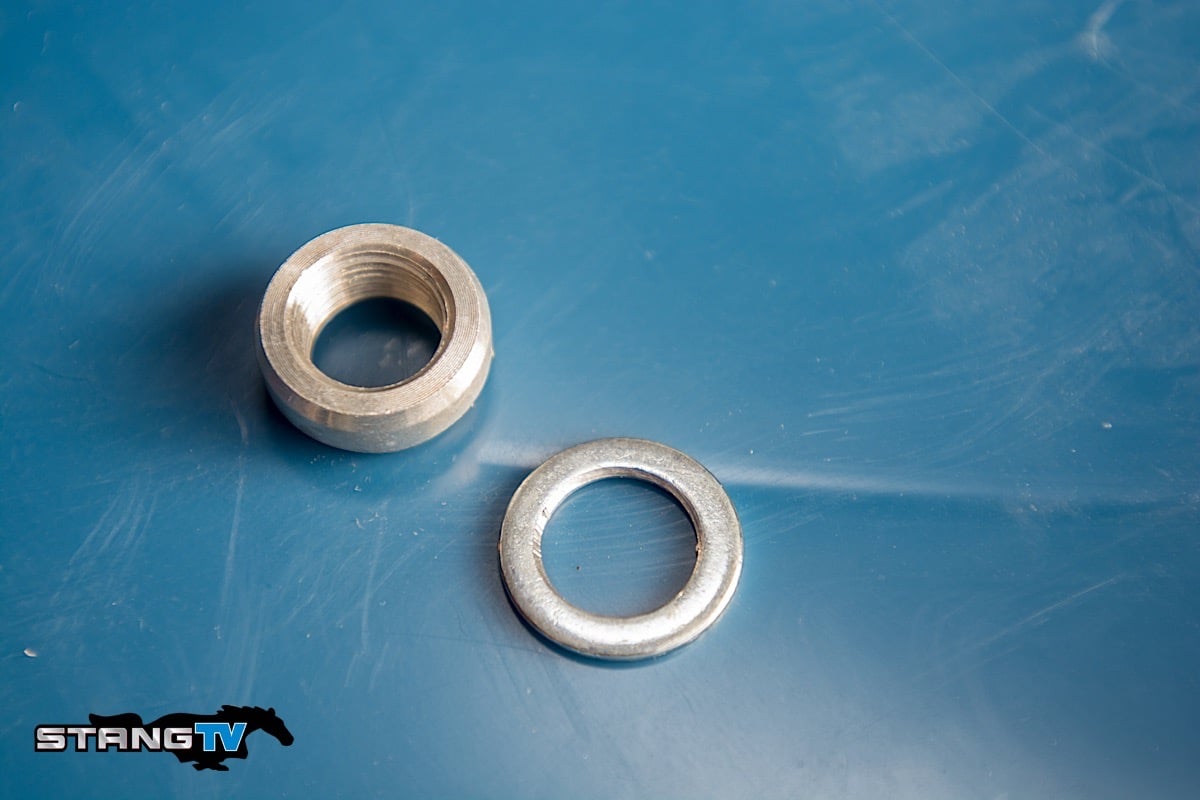
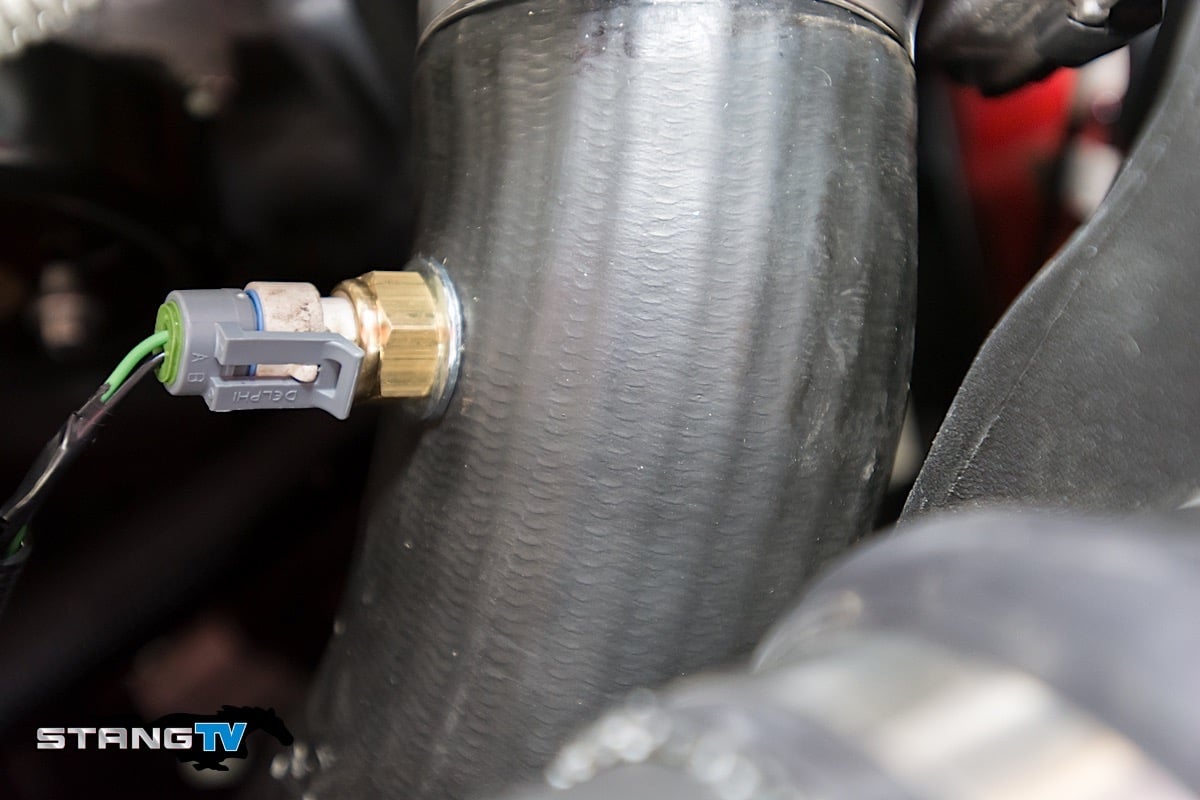
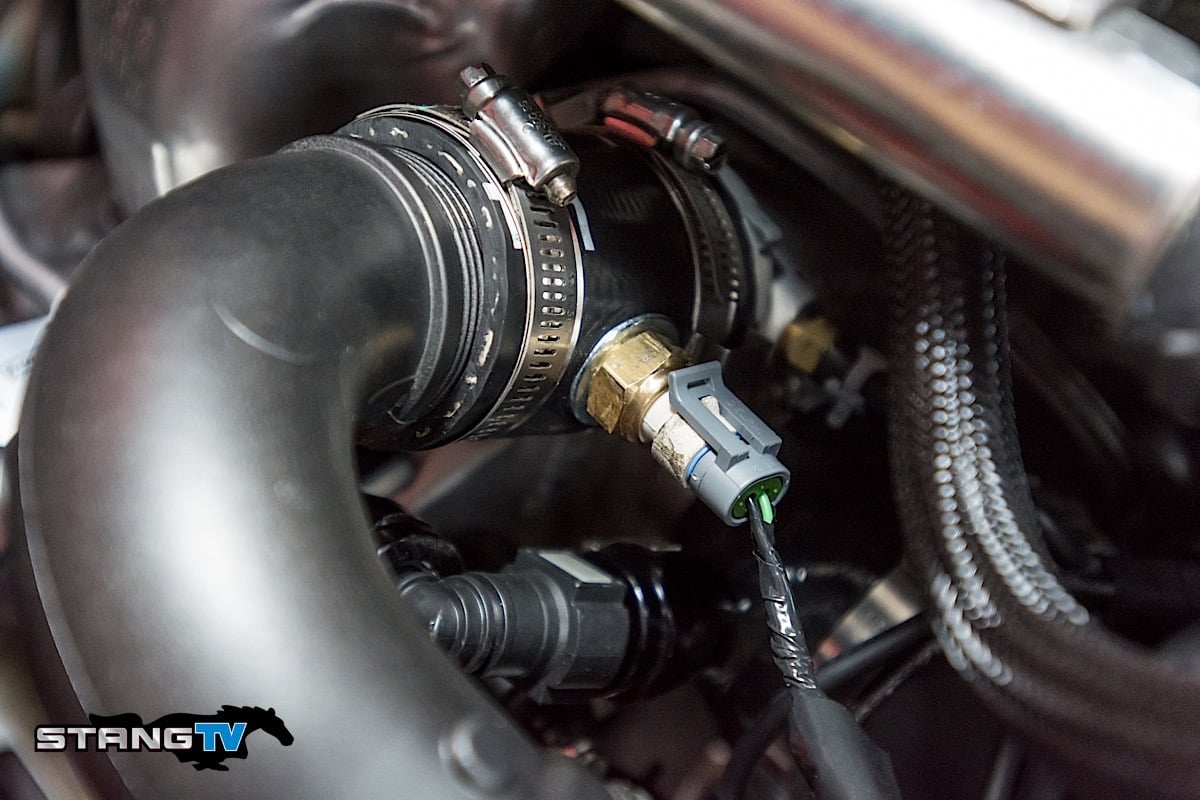
The EcoBoost engine uses rubber and plastic for the charge pipes, there's nowhere to weld in a bung for the new AIT sensors. So we used a short bung and drilled a 3/4-inch hole in the rubber cold side charge pipe. and the coupler at the turbocharger. We wouldn't recommend this method long-term, but it has held up through about 500 miles of testing and dyno runs so far. The charge pipes will be replaced in the near future with metal parts that will allow us to use the supplied AEM bungs.
The AQ-1 software allows users to set alarms and flag data when an alarm point is reached. For example, if you wanted to monitor intake air temperature and see if and when it reached above a certain point like 150° F. You can set an alarm for 150° F. After downloading the logs to AEM data and opening up the IAT channel, the alarm sections are highlighted. Users can then overlay additional data, or even open it up in additional lanes for side by side comparison. This can help determine what is causing the issue, or at least when it occurs and under what conditions. “This can be one of the most useful tools available to AQ-1 users,” Molica says.
There are multiple methods for displaying data, and playback occurs similar to that of a video. Users can follow their data in seconds, or minutes. They can also control the scaling of the data displayed in many of the selectable formats.
The AQ1 software allows for easy setup of each sensor. We made a couple of calls to tech support to make sure we had everything sorted out; each time they walked us through what we needed to adjust in just a couple of minutes.
Our personal favorite method for displaying data is to use the trace feature. This displays data across a timeline for quick analysis and viewing. Using this we can easily view peaks, valleys, spikes, or dips. Using the trace feature, we can also overlay additional channels, or add what AEM calls a lane of data, which allows us to sort our data horizontally.
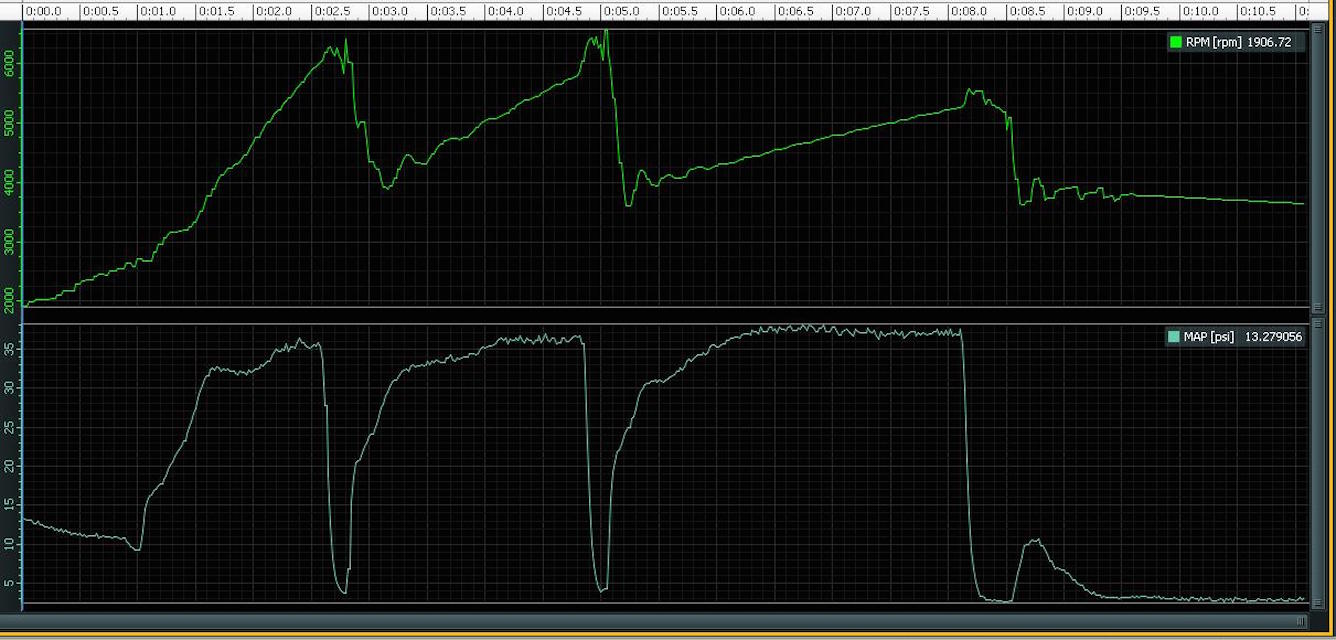
Using AEM data we can analyze what is going on with our car more accurately than just glancing at the gauges and judging something by the seat of our pants. This is a tool that will go hand-in-hand with using the dyno, or making a run at the track. This particular chart displays RPM at the top in a quick run through three gears and into fourth where we lifted just before fourth, as well as boost for the same run. See how the boost changes in third gear where we spend more time, and the engine is loaded more when compared to first or second gears where torque management is also a factor. Also look at the delay in boost in first gear. This is due to load and the computer’s torque management strategy.
We found AEM Data extremely easy to use, and it is this software that is key to understanding the information captured by any user. Using the AQ-1 software, we could monitor information as it is recorded on all of the inputs we’re currently using, or only one at a time. This allows us to check the results of modifications to our car, or changes in driving style and verify the results. If we’re adding more boost, or changing out the intercooler, we can verify changes in boost pressure, intake air temperature, and even look at characteristics like when is boost coming in and how does it rise and fall across our operating RPM range.
We can also analyze data from the drag strip and autocross in AEM Data. While our OEM-included Track Apps have been invaluable in testing suspension components, the AQ-1 will allow us to see when and where suspension or tire changes are helping or hurting our run. The same holds true for the drag strip, we can compare data from our best runs with our worst, and determine what is going on and hopefully remedy it.
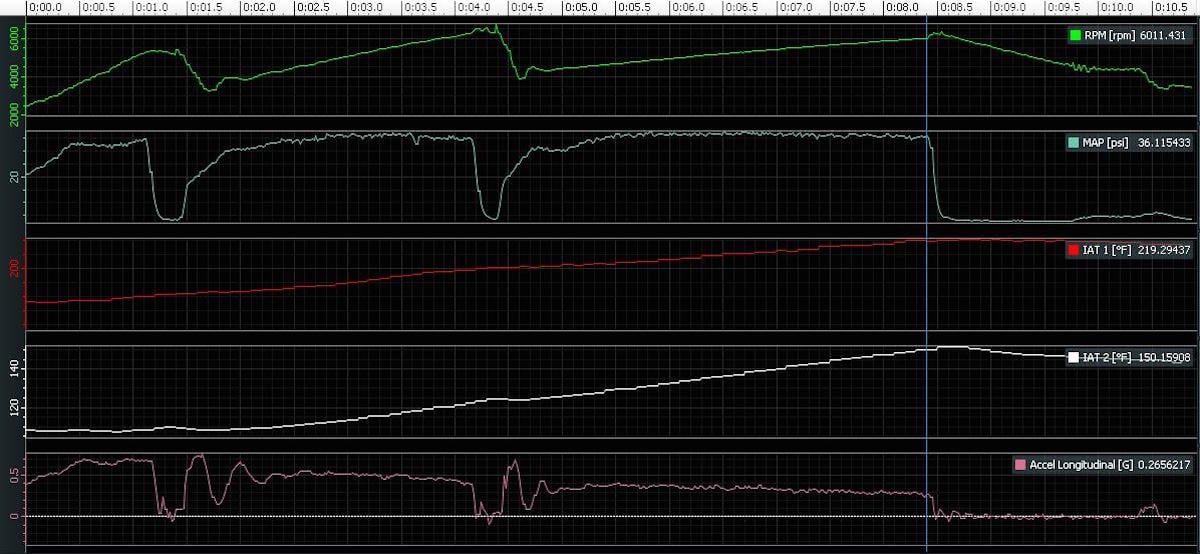
These are the five channels we are currently logging on our AQ-1. We’ll add wideband O2 to this once we install our new exhaust. Using the plot function and displaying data in additional lanes we can see over a 10.5 second acceleration from 0 MPH what our car is doing. This was a run through three gears. Look at the differences in boost in each gear (indicated by a sudden drop in RPM); also check out the longitudinal acceleration and how it changes with each gear shift. There is a lot of info here that shows us where the computer is limiting boost in first, and even second gears as part of torque management, how well our OEM intercooler works, and what kind of acceleration forces we’re experiencing. At the track, or doing a test on new parts this information can be invaluable.
AEM Data is as advanced or complex as a user wants to make it. While on the surface it allows for some basic functions like charting and monitoring various functions, it can also be used with some very complex math equations for deeper analysis, something we hope to learn more about from AEM as we dig deeper into the software.
Diagnosing Trouble
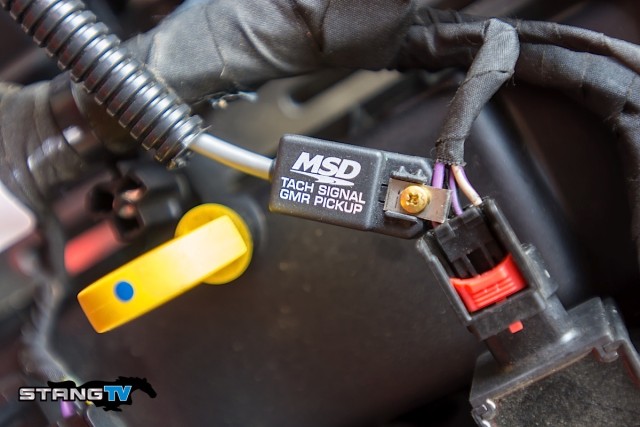
GMR Pickup
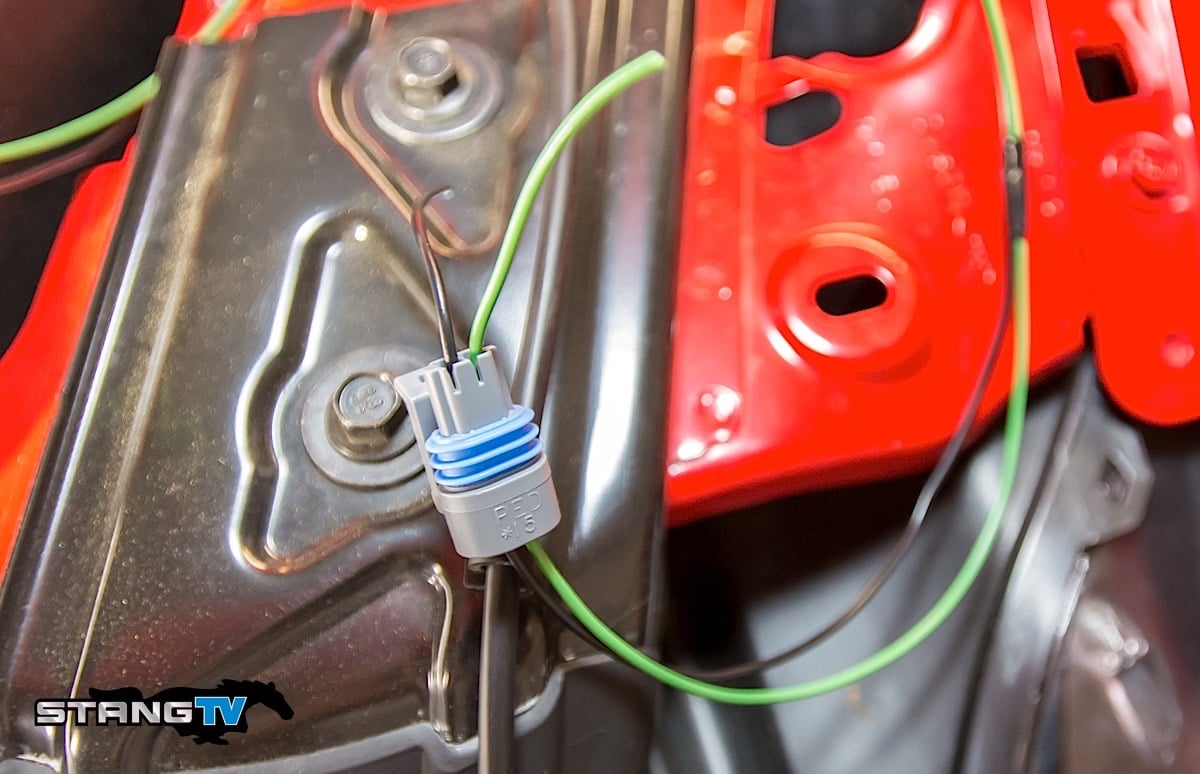
Like all modern Ford vehicles, our 2015 Mustang EcoBoost uses a coil over plug (COP) ignition system. To get an RPM signal for our AQ-1 we’re left with only a few choices. We can try to tap into the RPM signal via the PCM harness, or we can go to the coil. Ford COP ignition does not provide a square wave signal needed for the AQ-1. To get that, we turned to MSD for a GMR pickup. This device works like a powered sensor, we supplied sensor power and ground via the AQ-1, and then connected the sensor output wire to input channel six on the AQ-1. The GMR pickup clamps around one of the wires on the cylinder one ignition coil, capturing the signal and converting it to a square wave that the AQ-1 can identify.
Using the digital inputs, owners can tie in things like a nitrous solenoid that can be configured to show an on/off signal when the solenoid is activated. Now you’re not guessing if the solenoid is being triggered, you can see it in the data stream.
Another area we thought of was tying the AQ-1 into a RPM activated switch, like a shift light. Suppose you have a street car, or even a new setup, and while the dyno data is great, you’re not quite sure if you are short shifting on the drag strip, or even shifting at the right time. Comparing when the shift light comes on, and where a shift occurs (typically indicated by a drop in engine RPM) could be helpful. Combining this with data from the dyno, and timeslips at the track, can also have additional benefits. The AQ-1 becomes a tool, that in the hands of a discerning enthusiast can prove invaluable in both competition and enjoying your car.
Video
We didn’t want it to be specific to one manufacturer or camera type, so we allow for encoding of multiple videos. You simply sync the data stream with your video and select what information you want to appear in the video, along with its layout. -Lawson Molica
We’ve seen numerous racers already putting this to use, and are looking forward to it ourselves. Consider this: if you’re running the autocross, how much lateral g-force are you pulling in a particular corner, where were you on throttle position, speed, track position, at various points, how hot was your car getting, where did you brake, or accelerate? All of this information and more is available using the video integration feature. The same holds true for drag racing, did you miss a shift, over rev, did the nitrous system activate – at the right time? What kind of boost, driveshaft RPM, engine RPM, and vehicle speed? Were they all sync’d up, where does your car need a change or adjustment before the next round?
Install and Testing
We spent the better part of a day installing our AQ-1 system. This was in large part due to our lack of familiarity with the 2015 Mustang chassis. This isn’t like the Fox body or SN95 days where wires are easily poked through holes in the firewall.
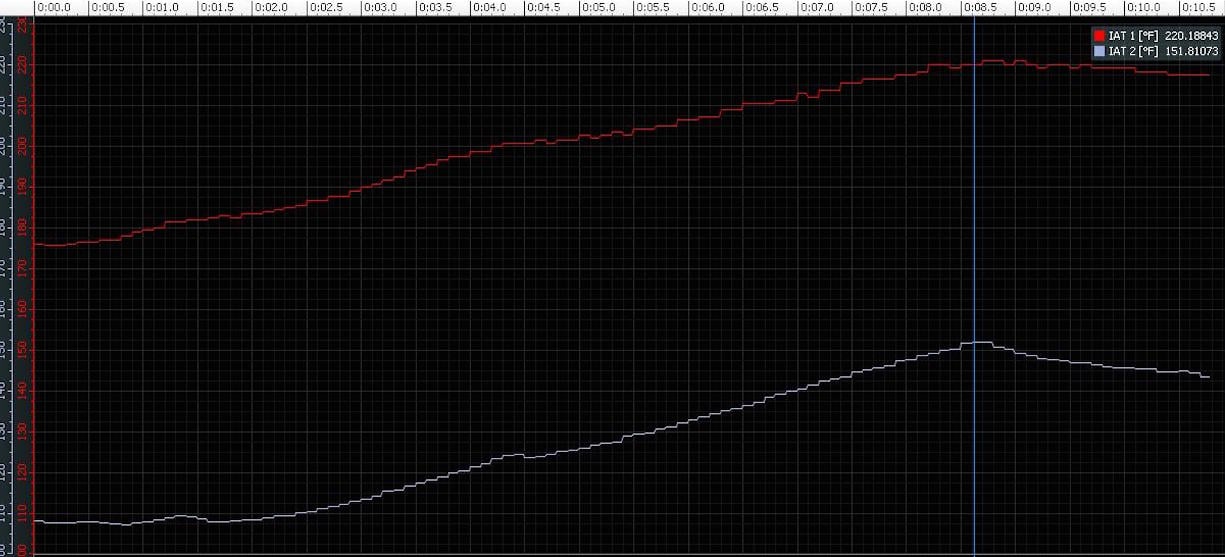
This particular screen shot is of our air inlet temperature (AIT) sensors on the same acceleration run we used above. We’ve overlaid them on the same scale to show the difference between hot and cold AIT on acceleration. This is an easy way to gauge how well our OEM intercooler functions, and how hot the hot side plumbing from our turbo gets. Notice that temperature differences under acceleration remain about 70 to 80 degrees apart for the duration of our test. Ambient temperatures during this time were around 90 degrees Fahrenheit.
We also received some help from Ron Francis Wiring (RFW) to supply proper power and wire shielding for our system. RFW provided us with a 4-gang fuse block, part number AB-4 which we used to trigger the 5-amp power circuits for our system. RFW also provided us with heat shielding for our wiring harness in the form of shielded wire loom, and its new heat sharing wire look to help us tidy everything up. We used RFW’s 40-amp relay kit, part number RL-40 to trigger the 5-amp circuits on our fuse block, and a power junction block, part number JB-57, for our constant power feeds. Not only will these parts help us with this install, but should we add other accessories like aftermarket gauges, water/methanol injection, or nitrous we, already have the hardest part of those wiring jobs completed by installing these parts now.
We’ will be back on the dyno and autocross very soon using our AQ-1 to test a variety of new parts on our project car.
We had to make two calls to AEM technical support for help with our system. One was to figure out how to get the setup correct for our MSD GMR pickup, part number 8918, available from Jegs.com as part number 21-8918 – which provides the RPM signal from the COP ignition (see sidebar), and the other when we were getting an erroneous reading from the MAP sensor we installed, which turned out to be our mistake in switching the sensor power and ground wires. Both were quickly remedied. The AEM staff was extremely helpful, and that speaks volumes about service after the sale.
We have since created multiple test logs using our AQ-1, but we haven’t been back to the track or autocross yet with the car, but we’re looking forward to gathering data there and utilizing the video feature of AEM Data.
With data acquisition on board from AEM’s AQ-1, we can better track the progress and performance of our project car. We’re looking forward to using this valuable tool with many of our future install stories.